Hi guys, welcome to today’s tutorial. Today we will build an advanced Arduino Data logger which will be able to store data for over 2 weeks in a CSV file to make it easy to import the file for processing.
Almost Six months ago, I built my first data logger project on this website using an Arduino Nano and the DS3231 Real Time Clock, a few weeks later, I posted the idea of building an improved version of the project on the website here along with many other project ideas, most of the visitors voted to build this project first, so here it is!
This Improved Arduino Datalogger is capable of logging, temperature, humidity, barometric pressure and light intensity for about 2 weeks with power being provided by AA batteries only. The datalogger stores the data on a Micro SD card in a .csv file format which makes it easy to import the file to any data processing software after it has been logged.
The sensors used to acquire the data that was logged for this tutorial includes:
DHT22: Temperature and Humidity sensor
BMP180: Barometric Pressure Sensor
BH1750: Light Intensity Sensor.
To achieve the project goals of low power consumption, we will be replacing the Arduino nano in the previous project with the Atmega328 chip with the Arduino Uno bootloader running on it since the atmeg328 chip consumes less power compared to any of the Arduino boards as it does not include all the peripherals that are present in the full-blown Arduino boards.
This project may be too complicated to build for a beginner, I will try to break it down and make it as simple as possible, I will advise that beginners should watch the following videos to deeply understand some of the concepts used in this tutorial.
Required Parts and Where to Buy
The following components/parts are required to build this project and each component can be bought through the link in front of it.
1. ATMEGA328: https://educ8s.tv/part/ATMEGA328P
2. 16Mhz Crystal: https://educ8s.tv/part/Crystal16
3. DS3231: https://educ8s.tv/part/DS3231
4. BMP180: https://educ8s.tv/part/BMP180
5. BH1750: https://educ8s.tv/part/BH1750
6. DHT22: https://educ8s.tv/part/DHT22
7. SD card module: http://educ8s.t-v/part/MicroSDModule
8. Large Breadboard: https://educ8s.tv/part/LargeBreadboard
9. FTDI programmer: https://educ8s.tv/part/FTDI
10. Jumper wires: https://educ8s.tv/part/JumperWires
11. Battery Case: https://educ8s.tv/part/BatteryHolderAA
12. Multimeter: https://educ8s.tv/part/Multimeter
13. Resistor: https://educ8s.tv/part/Resistors
14. Wires: https://educ8s.tv/part/Wires
15. LED: https://educ8s.tv/part/LEDs
16. Arduino Uno: https://educ8s.tv/part/ArduinoUno
[adsense]
Schematics
The schematic for this project is a little bit complicated but if followed carefully, you will be able to connect the components without stress. Connect the components as shown in the schematics below;
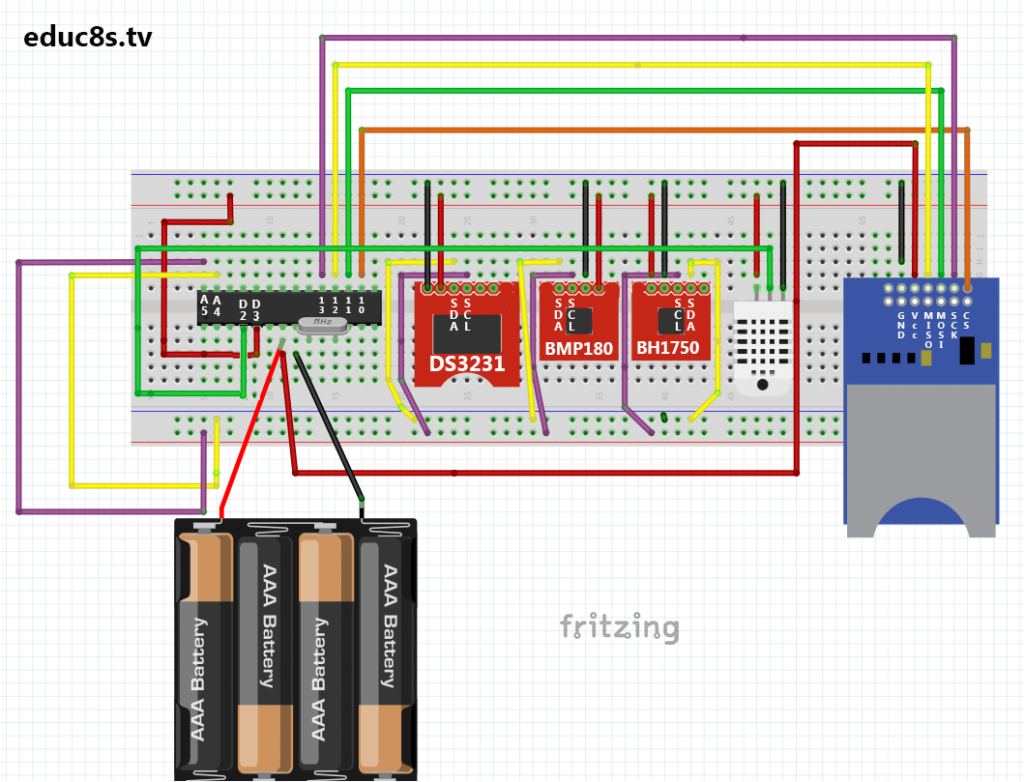
To better understand how the connections of each of the components used above works and why the components are connected, check out the tutorials in the links mentioned earlier above as they contain a detailed guide to how things work.
With the components all connected, we can then move to write the code for this project.
Code
To program the Atmeg328 chip, we will need an FTDI to USB module or an Arduino Uno in which we can insert the chip to program and remove it after programming.
One of the important improvements made to this project is the battery life or the on-time which is around 2 weeks. This was not achieved through the use of the Atemga328 microcontroller alone but in conjunction with the Low-power arduino library from rocketscream. The library supports all the sleeping modes of the atmeg328p microcontroller allowing you to shutdown thinks like the ADC, Brownout detector etc of the Arduino.
Other libraries used in the code are libraries to enable the microcontroller interface with the sensor. These libraries can be downloaded from the link below.
LIBRARIES
Low Power: https://github.com/rocketscream/Low-Power
BH1750: https://github.com/claws/BH1750
BMP180 library: https://learn.sparkfun.com/tutorials/bmp180-barometric-pressure-sensor-hookup-/installing-the-arduino-library
DHT22 library: https://github.com/adafruit/DHT-sensor-library
The Sodaq_DS3231 Real Time clock library can be downloaded directly from the Arduino IDE.
The task to be implemented in the code for this project is simple; collect data from all the sensors and save it in a CSV file on the SD card in the SD card module.
To do a brief explanation of the code, as usual, the first thing we do in the code as we always do is to include all the libraries needed to interface with all the components. Asides the libraries which were mentioned above to be downloaded, we added the SD, the wire, and the SPI library.
<?php
#include <LowPower.h>
#include <BH1750.h>
#include <SFE_BMP180.h>
#include <DHT.h>
#include <Wire.h>
#include "Sodaq_DS3231.h"
#include <SD.h>
#include <SPI.h>
?>
Next, we declare the pins of the microcontroller to which the components are connected. Since we have the Arduino Uno bootloader running on the microcontroller we can use the pin definitions we would have used if we were using the Arduino Uno itself. We also declare some of the variables that will be used for this project and created an instance of the libraries to be used.
<?php
#define DHTPIN 2
#define DHTTYPE DHT22   // DHT 22  (AM2302)

#define ALTITUDE 216.0 // Altitude in Sparta, Greece
char TEMPERATURE = 'C' ;  //Change it to F to log degrees Fahrenheit
int INTERVAL = 1; //interval of measurements in minutes
DateTime dt(2015, 12, 14, 9, 28, 40, 1);  //Date and time

int CS_PIN = 10;
int ledPin = 7;
int POWERPIN = 3;

File file;
DHT dht(DHTPIN,DHTTYPE);
SFE_BMP180 pressureSensor;
BH1750 lightMeter;
int id = 0;
?>
Next, we create the void setup function, setting the pin mode of the pins and initializing the SD card library.
<?php
void setup ()
{
   pinMode(POWERPIN, OUTPUT);
   digitalWrite(POWERPIN,HIGH);
   pinMode(ledPin, OUTPUT);
   initializeSD();

    //rtc.setDateTime(dt); //Adjust date-time as defined 'dt' above
}
?>
Next, we write the void loop function which is in charge of putting together all the functions to perform the task of getting sensor data and storing in the SD card as a CSV file.
<?php
void loop ()
{
    String temperature;
    String humidity;
    String light;
    String pressure;
    String entryId;
    String dateEntry;
    id++;

    digitalWrite(POWERPIN,HIGH);
    digitalWrite(ledPin,HIGH);

    delay(2000);
    initSensors();
    delay(10000);

    entryId = String(id);
    humidity = String(dht.readHumidity());
    if(TEMPERATURE =='F')
    {
      temperature = String(dht.readTemperature(true));
    }else
    {
      temperature = String(dht.readTemperature());
    }

    pressure = readPressure();
    light = readLight();
    dateEntry = DateLogEntry();

    String entry = entryId+","+dateEntry+","+temperature+","+humidity+","+pressure+","+light;
    writeEntryToFile(entry);
    delay(2000);
    sleepForMinutes(INTERVAL);

}
?>
More information about the code can be gotten from the video in the link above.
The code for this project and the schematics can be downloaded from the link below.
——————–
CODE OF THE PROJECT
——————–
To burn the code on the Atmega328p, I used an old Arduino board which I had, but you can also use the FTDI to USB Converter earlier mentioned. After uploading the code to the chip on the Arduino board, remove it and insert it back into your circuit. Ensure the chip is rightly inserted after which you can turn on(or connect ) the battery pack.
To demonstrate the low power consumption nature of this project, I used a multimeter to measure the current consumption. When the system turns on or it is taking a reading, the power consumption is always around 20mA, but after the reading has been recorded and the mirocontroller goes to sleep, the power consumption reduces to 3.5mA.
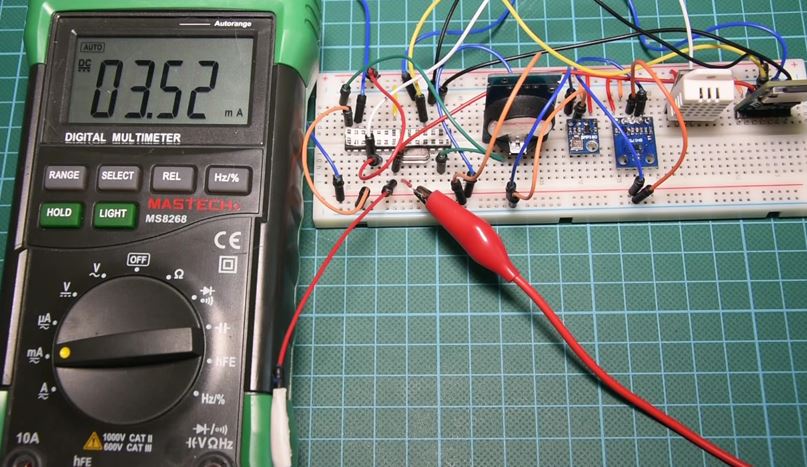
Theoretically, with this power consumption, the system could last over 2 weeks before the batteries are changed.
To test the project, I left it for a day with the logging interval set at 1 minute. a screenshot of the logged data plotted in excel is shown in the image below.
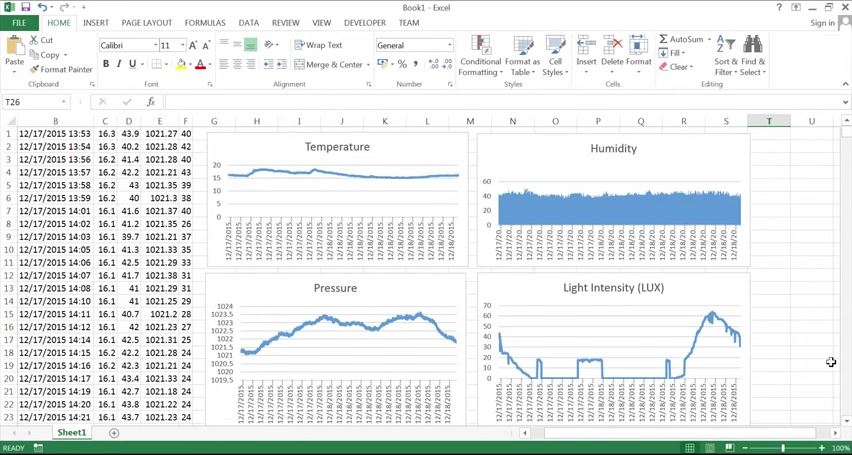
Result
That’s it for this tutorial guys, Feel free to drop any question you might have as regards the tutorial in the comment section below. Don’t forget to subscribe to our youtube channel so as to get notified when new videos are released.
SUBSCRIBE ON YOUTUBE
——————–
Never miss a video: Subscribe to educ8s.tv
Major thankies for the forum. Great. Brozina
Your Videos Are Amazing, Better Explained.
Could You Please Make Arduino Uno + PIR Sensor + RTC 3231 + SD Card Module Security DataLogger.
Thanks In Advance
Thanks for the code. This a great work. You saved my life.
Greetings from Brazil.
Hi,
I wanted to try to recreate this project but how would I do it on a arduino mega2560 R3. Could I get the SHEMATIC
Hello,
I am a subscriber of you and love the movie you make. They ar very clearly, simple and to the point.
I learned a lot from your video’s.
This project took my interest cause i can use it in my projects. it is like it fell from heaven.
But here is my question, I need 4 extra temp sensors + a screen where one can read the 5 measured temperatures
Is it possible to add this criteria to the script and schematics? Please…
.Thanks a lot.
Regards